 Download biomedica product list
FluoBolt™ Asporin FIA | FIA-1702


-
Method
Metal Enhanced Direct Sandwich Fluorescence Immunoassay in 96-well plate format
-
Sample type
Serum
-
Sample volume
10 µl / well
-
Assay time
over night / RT
-
Sensitivity
LOD (0 pmol/l + 3 SD): 1 pmol/l; LLOQ: 25 pmol/l
-
Standard range
0 – 400 pmol/l
0 – 16,4 ng/ml
-
Conversion factor
1 ng/ml = 4.5 pmol/l (MW: 55.7 kDa)
-
Regulatory status
Research use only
-
Cross-reactivity
Human ASPORIN shares around 99% aa sequence identity with higher apes (e.g. gorilla or chimpanzee) but only 90% with rat/mouse and 87% with bovine/ equine ASPORIN.
-
Detection target
This assay detects human ASPORIN. Addition of recombinant TGF-β1 to the standards supplied with this kit did not reduce signal intensity.
Product Overview
The FluoBolt™-ASPORIN immunoassay is a o.n, Metal Enhanced Direct Sandwich Fluorescence Immunoassay in 96-well plate format for the quantitative determination of ASPORIN in serum. The assay employs human based serum standards to ensure the measurement of biologically reliable data.
Principle Of The Assay
The FluoBolt™-ASPORIN immunoassay is a o.n, Metal Enhanced Direct Sandwich Fluorescence Immunoassay in 96-well plate format for the quantitative determination of ASPORIN in serum samples.
Figure explaining the principle of metal enhanced fluorescence:
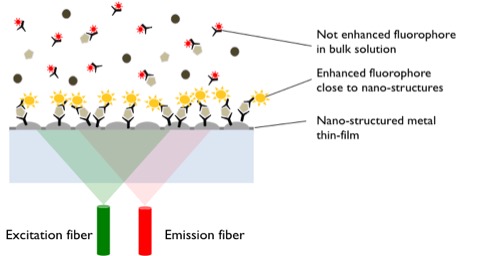
In a first step, standard/sample/control and detection antibody (fluorescent labelled anti-ASPORIN) are pipetted into the wells of the microtiter plate, which are pre-coated with anti-ASPORIN antibody. ASPORIN present in the standard/sample/control binds to the pre-coated antibody in the well and forms a sandwich with the detection antibody.
The signal of the bound fluorescent detection antibody is enhanced several hundred fold by the metal nano-structures at the plate bottom and thus highly sensitive detectable with a standard microtiter plate fluorescence reader. Measurements can either been done without washing (bottom measurement) or after a final washing step (top measurement). The concentration of ASPORIN in the sample is determined directly from the dose response curve.
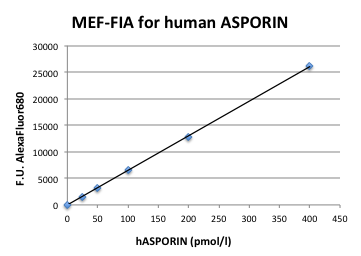
Typical Standard Curve
The figure below shows a typical standard curve for the FluoBolt™-ASPORIN ELISA. The immunoassay is calibrated against recombinant full length ASPORIN:
Kit Components
|
Contents |
Description |
Quantity |
|
EM |
Anti-human ASPORIN antibody, pre-coated MEF-microtiter plate, packed in vacuum sealed aluminium bag |
1 x 96 well |
|
WP |
20 X wash buffer concentrate |
1 x 25 ml |
|
F AF, EA3, EA5, EAA |
Anti-human ASPORIN antibody, black flask, labeled with FITC, Cy3, Cy5 or AlexaFluor680 |
1 x 5 ml |
|
ES |
Serum-based standards 1-6, (0, 25, 50, 100, 200, 400 pmol/l), white caps, lyophilized |
6 vials, 0.25 ml |
|
ECA/B |
Serum-based controls with expected concentrations after reconstitution (lyophilised) |
2 vials, 0.25 ml |
|
ED |
Sample diluent, natural cap, ready to use |
1 x 10 ml |
Storage instructions: All reagents of the FluoBolt™-ASPORIN immunoassay kit are stable at 4°C until the expiry date stated on the label of each reagent.
Sample Collection & Storage
ASPORIN contains a calcium binding site. When using plasma samples, analytic recovery of the protein strongly varies depending on the amount and type of coagulant used. Therefore we recommend to only use serum samples for ASPORIN analysis. Collect venous blood samples by using standardized blood collection tubes for serum. Collect venous blood samples by using standardized blood collection tubes for serum. We recommend performing serum separation by centrifugation as soon as possible, e.g. 10 min at 2000 x g, preferably at 4°C (2-8°C). The acquired serum samples should be measured as soon as possible. For longer storage aliquot samples and store at -25°C or lower. Do not freeze-thaw samples more than 4 times
Urine
Urine has not been evaluated as sample type for this assay.
Cell Culture Supernatant
Cell Culture Supernatant has not been evaluated as sample type for this assay.
Reagent Preparation
Wash Buffer
|
1. |
Bring the WASHBUF concentrate to room temperature. Crystals in the buffer concentrate will dissolve at room temperature. |
|
2. |
Dilute the WASHBUF concentrate 1:20, e.g., 50ml WASHBUF + 950ml distilled or deionized water. Only use diluted WASHBUF when performing the assay. |
The diluted WASHBUF is stable up to one month at 4°C (2-8°C).
Standards & Controls For Serum, Plasma, And Urine Measurements
|
1. |
Add 250 µl of distilled or deionized water to the lyophilized ES (Standards) and EC (Controls). Reconstituted ES and EC are stable at -25°C or lower until expiry date stated on the label. Reconstituted ES and EC can undergo 4 freeze-thaw cycles. |
|
2. |
Leave at room temperature (18-26°C) for 20 min. Swirl gently. |
Reconstituted ES and EC are stable at -25°C or lower until expiry date stated on the label. Reconstituted ES and EC can undergo 4 freeze-thaw cycles.
Sample Preparation
All reagents and samples must be at room temperature (18-26°C) before use in the assay.
Assay Protocol
Read the entire protocol before beginning the assay.
In standard format, the kit is delivered with an AlexaFluor680 labelled detection antibody (EAA) because serum background fluorescence is minimal within this wavelength range. Therefore if your reader is equipped with monochromatic optics, please set Excitation/Emission to 679/702 nm or if you are using an optical filter based reader, select a suitable filter pair (e.g. 670/720 nm). On request the kit can also be delivered with FITC, Cy3 or Cy5 (Ex/Em = 495/518 nm, 550/570 nm or 650/670 nm) labelled detection antibody
Mark positions for STD/SAMPLE/CTRL (Standard/Sample/Control) on the protocol sheet.
|
1. |
Take the plasmonic enhanced microtiter plate out of the aluminum bag. Avoid touching the bottom of the plate with bare hands, because reading without washing is performed through the well bottom |
|
2. |
Add 50 µl of the selected fluorescence labeled detection antibody (EAF or EA3 or EA5 or EAA) to all wells required. Swirl gently. |
|
3. |
Add 10 µl of standard, control or sample to the wells according to the marked positions on the protocol sheet, swirl gently, |
|
4. |
Cover tightly with the delivered adhesive film and incubate over night at RT in the dark. |
|
5a. |
If your reader allows bottom reading, read the plate without any further processing at the Ex/Em wavelength fitting to the delivered detection antibody (495/518 nm for EAF, 550/570 nm for EA3, 650/670 nm for EA5, 679/702 nm for EAA). Gain should be set to achieve at least 10000 fluorescence units (F.U.) between the signal of the 0 pM and the 400 pM ASPORIN standard. Samples with signals exceeding the signal of the highest standard must be re-run with an appropriate dilution using sample diluent (ED). |
|
5b. |
If your reader has no bottom read option or if you want to store the plate for documentation purposes, discard or aspirate the content of the wells and wash 3x with diluted wash buffer. Use a minimum of 200 µl wash buffer per well. After the final wash, remove remaining fluid by strongly tapping the plate against a paper towel. Read the plate in top configuration without any further processing at the Ex/Em wavelength fitting to the chosen detection antibody (495/518 nm for EAF, 550/570 nm for EA3, 650/670 nm for EA5, 679/702 nm for EAA). |
|
7. |
Hint: Quality of bottom reading (5a) may vary between microplate readers. For first time users we suggest to perform the washing step and follow protocol 5b. |
|
8. |
The gain of your reader should be set to achieve at least 10000 fluorescence units (F.U.) between the signals of the 0 pM and the 400 pM ASPORIN standard. Samples with signals exceeding the signal of the highest standard must be re-run with appropriate dilution using sample diluent (ED). |
|
9. |
Store the plate with the 2 desiccant bags supplied at 4°C (2-8°C) in the aluminum bag. Unused wells are stable until expiry date stated on the label. Fluorescence signals of standards, controls and samples remain detectable for at least two month at the plate surface, depending on signal intensity achieved |
Calculation Of Results
Subtract the fluorescence intensity of the 0 pM standard from all other standards, samples and controls. Construct a calibration curve from the fluorescence units (F.U.) of the standards using commercially available software or graph paper. Read sample and control concentrations from this standard curve. Make sure to use appropriate curve fitting algorithm (e.g. linear or 4PL).
The quality control (QC) protocol supplied with the kit shows the results of the final release QC for each kit lot at production date.
Fluorescence intensity obtained by customers may differ due to various influences and/or due to the normal decrease of signal intensity during shelf life. However, this does not affect validity of results as long as the supplied kit controls read according to specifications (target ranges see labels).
INFORMATION ON THE ANALYTE
ASPORIN, also known as periodontal ligament-associated protein 1 (PLAP1) is a dimeric secreted extracellular matrix protein, which belongs to the small leucine-rich proteoglycan (SLRP) family. It consist out of 380 amino acids and has a highly conserved pro peptide sequence which contains a series of leucine rich repeats and are flanked by two cysteine residues in the C Terminal region. Further it has four cysteine residues that form disulphide bonds as well as aspartic acid repeats in the N-Terminal region.
ASPORIN is known to negatively regulate PDL differentiation and mineralisation as well as it inhibits BMP- dependent activation of SMAD proteins. Further, it directly binds to TGFb-1 subsequently, binds to collagen by way of its LRR domain. Through its interaction with TGFb-1, ASPORIN negatively regulates chondrogenesis in the articular cartilage by blocking the TGF-beta/receptor interaction on the cell surface and inhibiting canonical TGF-beta/Smad signalling. Moreover, it has the ability to bind calcium, giving it regulatory properties in osteoblast driven mineralisation and regulates FGF2 through direct and indirect interactions. Next to its regulatory properties in terms of cartilage and bone homeostasis, ASPORIN expression has also been linked to cancer invasion and progression. However, its value as biomarker remains to be established yet
Literature
-
Metal-enhanced fluorescence: an emerging tool in biotechnology. Aslan K, et al. Curr Opin Biotechnol, Feb 2005; 16(1):55-62.
-
Asporin and Osteoarthrities Xu et al., Osteoarthritis and Cartilage. 2015 Jun; 23(6): 933-939. Volume 23, Issue 6, June 2015, Pages 933-939
-
Replication of association of the D-repeat polymorphism in asporin with osteoarthristis Ikegawa et al. , Arthritis Res Ther. 2006; 8(4): 403.
-
Cartilage Intermediate Layer Protein and Asporin Polymorphisms Are Independent Risk Factors of Lumbar Disc Degeneration in Male Collegiate Athletes Seok-KiMin et al., Cartilage. 2014 Jan; 5(1): 37-42.
-
Asporin, a susceptibility gene in osteoarthritis, is expressed at higher levels in the more degenerate human intervertebral disc Gruber et al., Arthritis Res Ther. 2009; 11(2): R47.
-
Asporin Is a Fibroblast-Derived TGF-β1 Inhibitor and a Tumor Suppressor Associated with Good Prognosis in Breast Cancer. Maris et al., PLoS Med. 2015 Sep 1;12(9)
-
Asporin Is a Fibroblast-Derived TGF-β1 Inhibitor and a Tumor Suppressor Associated with Good Prognosis in Breast Cancer. Maris P, et al. . PLoS Med. 2015 Sep 1;12(9):e1001871.
-
The dual role of asporin in breast cancer progression. Simkova et al. Oncotarget. 2016 Aug 9; 7(32): 52045–52060.
-
Asporin is a stromally expressed marker associated with prostate cancer progression. Rochette et al. Br J Cancer. 2017 Mar 14;116(6):775-784.
All FluoBoltTM IMMUNOASSAYs are validated according to sensitivity, specificity, precision, accuracy, dilution linearity, sample stability, expected values in blood donor collections and sample matrix.
Calibration
The FluoBoltTM ASPORIN immunoassay is calibrated against recombinant human ASPORIN protein (AA 33-380 of Q9BXN1 (Uniprot ID)).
Detection Limit & Sensitivity
To determine the sensitivity of the FluoBoltTM ASPORIN immunoassay, experiments measuring the Lower Limit of Detection (LOD) and the lower limit of quantification (LLOQ) were conducted.
The LOD, also called the detection limit, is the lowest point at which a signal can be distinguished above the background signal, i.e. the signal that is measured in the absence of ASPORIN, with a confidence level of 99%. It is defined as the mean back calculated concentration of standard 1 (0 pmol/l of ASPORIN, three independent measurements) plus three times the standard deviation of the measurements.
The LLOQ, or sensitivity of an assay, is the lowest concentration at which an analyte can be accurately quantified. The criteria for accurate quantification at the LLOQ are an analyte recovery between 75 and 125% and a coefficient of variation (CV) of less than 25%. To determine the LLOQ, standard 2, i.e. the lowest standards containing ASPORIN, is diluted, measured three times and its concentration back calculated. The lowest dilution, which meets both criteria, is reported as the LLOQ.
The following values were determined for the FluoBoltTM ASPORIN immunoassay:
|
LOD |
10 pmol/l |
|
LLOQ |
25 pmol/l |
Precision
The precision of an FluoBoltTM ASPORIN immunoassay is defined as its ability to measure the same concentration consistently within the same experiments carried out by one operator (within-run precision or repeatability) and across several experiments using the same samples but conducted by several operators at different locations using different FluoBoltTM ASPORIN immunoassay lots (in-between-run precision or reproducibility).
Within-Run Precision
Within-run precision was tested by measuring the same samples 3 times within one FluoBoltTM ASPORIN immunoassay lot. The experiment was conducted by one operator. Samples reading above the highest standard were diluted with the sample diluent provided in the kit .
|
Sample 1 |
Sample 2 |
Sample 3 |
Sample 4 |
|
|
Mean (pmol/l) |
257,5 |
380,4 |
199,8 |
90,4 |
|
SD (pmol/l) |
9,1 |
21,1 |
13,4 |
2,3 |
|
CV (%) |
3,6% |
12,7% |
6,7% |
10,4% |
In-Between-Run Precision
In-between-run precision was assessed by measuring the same samples 3 times within multiple FluoBoltTM ASPORIN immunoassay lots. The measurements were carried out by one operator.
|
Sample 1 |
Sample 2 |
Sample 3 |
Sample 4 |
|
|
Mean(pmol/l) |
235,5 |
46,6 |
398,8 |
97,1 |
|
SD (pmol/l) |
15,9 |
2,5 |
36,6 |
4,3 |
|
CV (%) |
6,8% |
5,3% |
9,2% |
4,4% |
Accuracy
The accuracy of an FluoBoltTM ASPORIN immunoassay is defined as the precision with which it can recover samples of known concentrations.
The recovery of the FluoBoltTM ASPORIN immunoassay was measured by adding recombinant ASPORIN to clinical samples containing a known concentration endogenous ASPORIN. The %recovery of the spiked concentration was calculated as the percentage of measured compared over the expected value.
This table shows the summary of the recovery experiments in the FluoBoltTM ASPORIN immunoassay for serum samples. When using plasma samples, analytic recovery of the protein strongly varies depending on the amount and type of coagulant used. Therefore, we recommend to only use serum samples for ASPORIN analysis.
|
Sample ID |
||||
|
#1 |
#2 |
#3 |
#4 |
|
|
Measured(pM) |
397 |
496 |
89 |
462 |
|
Expected (pM) |
375 |
437 |
85 |
356 |
|
% Recovery |
106% |
113% |
105% |
130% |
Dilution Linearity
Tests of dilution linearity and parallelism ensure that both endogenous and recombinant samples containing ASPORIN behave in a dose dependent manner and are not affected by matrix effects. Dilution linearity assesses the accuracy of measurements in diluted clinical samples spiked with known concentrations of recombinant analyte. By contrast, parallelism refers to dilution linearity in clinical samples and provides evidence that endogenous analyte behaves same way as the recombinant one. For dilution linearity and parallelism are assessed for each sample type and are considered good if the results are within 20% of the expected concentration.
Dilution linearity was assessed by serially diluting clinical samples spiked with recombinant ASPORIN with standard 1 (serum stripped of ASPORIN).The figure and table below show the mean recovery and range of serially diluted recombinant ASPORIN in human samples. Linearty did not differ between human serum and plasma:
-
Measured (pM)
Dilution
Sample #1
Sample #2
Sample #3
1+0
126,8
252,8
86,8
1+2
37,1
75,8
26,5
1+9
11,0
26,7
6,5
Expected (pM)
1+2
42,3
84,3
28,93
1+9
12,7
25,3
8,68
Linearity (%)
1+2
88%
90%
92%
1+9
87%
106%
75%
Specificity
Analyte Specificity:
This assay detects free bioactive human ASPORIN as well as ASPORIN bound to TGF-β1, wich was demonstratedby the fact, that addition of recombinant TGF-β1 to the standards supplied with this kit did not reduce signal intensity.
Species Specificity:
Human ASPORIN shares around 99% aa sequence identity with higher apes ( e.g. gorilla or chimpanzee) but only 90% with rat/mouse and 87% with bovine/ equine ASPORIN. Cross reactivity of this assay with other species than human has not been tested. So using this assay for those species with high sequence homology may be possible, but must be evaluated by the user. FIANOSTICS does not take responsibility for functionality of the assay in non-human samples.
Sample Stability
The stability of endogenous ASPORIN was tested by incubation of clinical samples at room temperature for a specific period of time and by subjection samples to repeated freeze / thaw cycles.
|
|
Fluorescent Units |
|||
|
|
t=0 |
t=1h |
t=5h |
o.n. |
|
Sample #1 |
25326 |
25125 |
25561 |
24533 |
|
Sample #2 |
26881 |
27138 |
26306 |
25733 |
|
Sample #3 |
27365 |
29032 |
27336 |
26937 |
|
Sample #4 |
40799 |
42367 |
38440 |
39609 |
|
|
% Signal retained |
|||
|
Sample #1 |
100% |
97% |
75% |
70% |
|
Sample #2 |
100% |
87% |
79% |
58% |
|
Sample #3 |
100% |
97% |
79% |
77% |
|
Sample #4 |
100% |
84% |
71% |
64% |
|
Mean |
100% |
92% |
71% |
67% |
Samples should not be kept at Room Temperature for more than one hour to avoid significant losses of signal
Freeze/Thaw Stability
For freeze-thaw experiments, samples were collected according to the supplier’s instruction using blood collection devices and stored at -80°C. Reference samples were freeze-thawed once. The mean recovery of sample concentration after five freeze-thaw cycles is 97%.
|
|
Fluorescent Units |
||||
|
|
Cycle 1 |
Cycle 2 |
Cycle 3 |
Cycle 4 |
Cycle 5 |
|
Sample #1 |
29177 |
29386 |
28442 |
28200 |
28347 |
|
Sample #2 |
33315 |
35339 |
32385 |
31901 |
31674 |
|
|
% Signal retained |
||||
|
Sample #1 |
100% |
97% |
94% |
96% |
97% |
|
Sample #2 |
100% |
100% |
95% |
96% |
96% |
|
Mean |
100% |
99% |
95% |
96% |
97% |
Samples can be freez/thawed for at least five times.
Sample Values
Asporin Values In Apparently Healthy Individuals
To provide expected values for circulating ASPORIN, a panel of samples from a collection of blood donors (aged 18-69 years) was tested.
A summary of the results is shown below:
|
ASPORIN (pmol/L) |
||
|
Percentiles |
female (n=25) |
male (n=23) |
|
90 |
36,9 |
39,4 |
|
70 |
29,0 |
31,5 |
|
Median |
23,6 |
22,0 |
|
30 |
16,8 |
17,8 |
|
10 |
5,02 |
6,17 |
No dependency on age, sex or sample matrix was found.
Matrix Comparison
When using plasma samples, analytic recovery of the protein strongly varies depending on the amount and type of coagulant used. This may be an effect caused by the calcium binding site this molecule contains. Therefore, we recommend to only use serum samples for ASPORIN analysis.
-
Functional polymorphisms in asporin and CILP together with joint loading predispose to hand osteoarthritis.
Taipale M et al., BMC Genet. 2017, 12;18(1):108.
 PMID:29233086
 -
Asporin is a stromally expressed marker associated with prostate cancer progression.
Rochette A et al., Br J Cancer. 2017 ;116(6):775-784.
PMID:28152543 -
Asporin enhances colorectal cancer metastasis through activating the EGFR/src/cortactin signaling pathway.
Wu H et al., Oncotarget. 2016 ;7(45):73402-73413.
PMID:27705916 -
The dual role of asporin in breast cancer progression.
Simkova D et al., Oncotarget. 2016;7(32):52045-52060.
PMID:27409832 -
D14 repeat polymorphism of the asporin gene is associated with primary osteoarthritis of the knee in a Mexican Mestizo population.
González-Huerta NC et al. , Int J Rheum Dis. 2017;20(12):1935-1941.
PMID:26620055 -
Asporin Is a Fibroblast-Derived TGF-β1 Inhibitor and a Tumor Suppressor Associated with Good Prognosis in Breast Cancer.
Maris P et al., PLoS Med. 2015 ;12(9):e1001871.
PMID:26327350 -
Asporin and osteoarthritis.
Xu L et al. , Osteoarthritis Cartilage. 2015 ;23(6):933-9.
PMID:25689697 -
Asporin, a candidate protein for treatment of disc degenerative disease.
Tian W et al. , Chin Med J (Engl). 2013;126(2):369-72.
PMID:23324291
