Mouse Periostin ELISA | BI-20433MS
-
Method
Sandwich ELISA, HRP/TMB, 12×8-well detachable strips
-
Sample type
Mouse serum, plasma, protocol for cell culture samples on request.
-
Sample volume
≤ 5 µl / well
-
Assay time
3 h / 1 h / 30 min
-
Sensitivity
0.003 nmol/l (= 0.27 ng/ml)
-
Standard range
0 – 16 nmol/l (= 0 – 1,400 ng/ml)
-
Conversion factor
1 pmol/l = 90.1 pg/ml (MW: 90.1 kDa)
-
Precision
In-between-run (n=15): ≤ 6 % CV
Within-run (n=5): ≤ 6 % CV
-
Specificity
Endogenous and recombinant mouse Periostin.
-
Use
Research use only.
-
Validation Data
See validation data tab for: precision, accuracy, dilution linearity etc.
Mouse Periostin ELISA Product Overview
The Mouse Periostin ELISA kit is a 4.5 hour, 96-well sandwich ELISA for the quantitative determination of Periostin in mouse serum and plasma.
Mouse Periostin ELISA Assay Principle
This Periostin Assay is a sandwich enzyme immunoassay for the quantitative determination of Periostin in mouse serum and plasma samples.
The figure below explains the principle of the Mouse Periostin sandwich ELISA:
Capture antibody: monoclonal mouse anti-mouse Periostin antibody
Detection antibody: polyclonal goat anti-mouse Periostin antibody, biotin labeled
Target antigen: mouse Periostin
In a first step, standard/control/sample and detection antibody (biotinylated goat anti-mouse Periostin) are pipetted into the wells of the microtiter strips, which are pre-coated with monoclonal mouse anti-Periostin antibody. Periostin present in the sample binds to the pre-coated antibody in the well and forms a sandwich with the detection antibody. In a wash step non-specific unbound material is removed. In a next step, conjugate (strepatvidin-HRP) is added and reacts with the detection antibody. After another washing step, the substrate (TMB, tetramethylbenzidine) is pipetted into the wells. The enzyme-catalyzed color change of the substrate is directly proportional to the amount of mouse Periostin present in the sample. This color change is detectable with a standard microtiter plate reader. A dose response curve of the absorbance (optical density, OD at 450 nm) vs. standard concentration is generated, using the values obtained from the standard. The concentration of mouse Periostin in the sample is determined directly from the dose response curve.
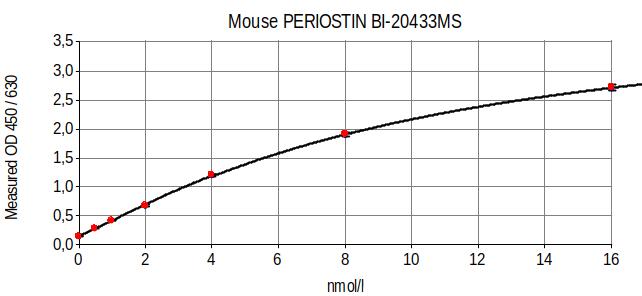
Mouse Periostin ELISA Typical Standard Curve
The figure below shows a typical standard curve for the Periostin ELISA kit mouse:
Mouse Periostin ELISA Kit Components
|
Contents |
Description |
Quantity |
|
PLATE |
Mouse monoclonal anti-mouse Periostin antibody pre-coated microtiter strips in a strip holder, packed in an aluminum bag with desiccant |
12 x 8 tests |
|
WASHBUF |
Wash buffer concentrate 20x, natural cap |
1 x 50 ml |
|
STOCK STD |
Stock standard (16 nmol/l), recombinant mouse Periostin, red cap, lyophilized |
1 vial |
|
CTRL |
Control, yellow cap, lyophilized, exact concentration see label |
1 vial |
|
ASYBUF |
Assay buffer, red cap, ready to use |
1 x 110 ml |
|
AB |
Goat polyclonal anti-mouse Periostin antibody, biotinylated, green cap, ready to use |
1 x 7 ml |
|
CONJ |
Conjugate, (streptavidin-HRP), amber bottle, amber cap, ready to use |
1 x 18 ml |
|
SUB |
Substrate (TMB solution), amber bottle, blue cap, ready to use |
1 x 22 ml |
|
STOP |
Stop solution, white cap, ready to use |
1 x 7 ml |
Storage instructions: all reagents of the mouse Periostin ELISA kit are stable at 4°C until the expiry date stated on the label of each reagent.
Sample Collection & Storage
Serum and plasma are suitable for use in this Periostin kit. We recommend duplicate measurements for all samples, standards and controls. Do not change sample type during studies. The sample collection and storage conditions listed are intended as general guidelines.
Serum & Plasma
Collect venous blood samples by using standardized blood collection tubes for serum or plasma. Perform serum and plasma separation by centrifugation according to supplier’s instructions of the blood collection devices and measure the acquired serum or plasma samples as soon as possible. For longer storage aliquot and store samples at -25°C or lower. Samples are stable for at least four freeze-thaw cycles. Thawed samples should be assayed as soon as possible. Lipemic or haemolyzed samples may give erroneous results.
Reagent Preparation
Wash Buffer
|
1. |
Bring the WASHBUF concentrate to room temperature. Crystals in the buffer concentrate will dissolve at room temperature. |
|
2. |
Dilute the WASHBUF concentrate 1:20, e.g. 50 ml WASHBUF + 950 ml distilled or deionized water. Only use diluted WASHBUF when performing the assay. |
The diluted WASHBUF is stable up to one month at 4°C (2-8°C).
Control
|
1. |
Pipette 200 µl of distilled or deionized water into the control (CTRL) vial. The exact concentration is stated on the label of the vial. |
|
2. |
Leave at room temperature (18-26°C) for 15 min. Vortex gently. |
|
3. |
CTRL must be diluted 1+200 with ASYBUF (assay buffer) prior to the assay, e.g. 5 µl CTRL + 1000 µl ASYBUF (or 2.5 µl CTRL + 500 µl ASYBUF). |
Note: 100 μl pre-diluted CTRL is required per well.
Reconstituted CTRL is stable at -25°C or lower until expiry date stated on the label and can undergo at least three freeze-thaw cycles. Pre-diluted CTRL should be measured as soon as possible (do not store or freeze).
Standards
|
1. |
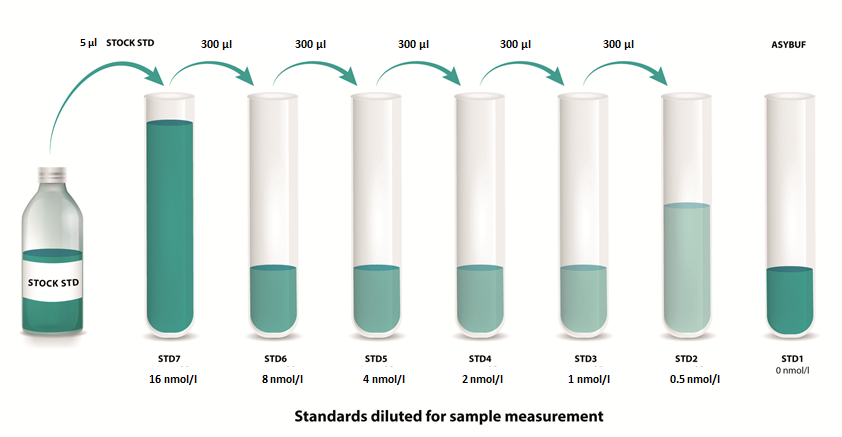
Reconstitute the STOCK STD (stock standard) in 200 µl deionized water. Leave at room temperature (18-26°C) for 15 min and mix well prior to making dilutions. |
|
2. |
Mark tubes STD7 to STD1. Use polypropylene tubes. |
|
3. |
Pipette 1000 µl of ASYBUF (assay buffer) into tube marked as STD7. |
|
4. |
Pipette 300 µl of assay buffer into tubes marked as STD6 to STD1. |
|
5. |
Pipette 5 µl of the reconstituted STOCK STD into tube marked as STD7. Mix thoroughly. |
|
6. |
Prepare a two-fold serial dilution to obtain STD6 to STD2. Pipette 300 µl STD7 into the tube labeled STD6. Mix thoroughly. Continue serial dilutions for STD5, STD4, STD3, STD2. |
|
7. |
ASYBUF serves as STD1 (= 0 nmol/l mouse Periostin). |
Note: 100 µl pre-diluted STD is required per well.
Established standard curve already includes the 1+200 assay pre-dilution, thus sample concentrations can be calculated directly from the standard curve without considering the 1+200 sample pre-dilution (see also chapter calculation of results).
Reconstituted STOCK STD is stable at -25°C or lower until expiry date stated on the label and can undergo at least three freeze-thaw cycles. Diluted STDs (standards) should be measured as soon as possible (do not store or freeze).
Sample Preparation
Bring samples to room temperature and mix samples gently to ensure the samples are homogenous. We recommend duplicate measurements for all samples.
Samples must be diluted 1+200 with ASYBUF (assay buffer) prior to the assay, e.g. 5 µl sample + 1000 µl ASYBUF.
Note: 100 μl pre-diluted sample is required per well.
Samples for which the OD value exceeds the highest point of the standard range can be further diluted with ASYBUF. Diluted samples should be measured as soon as possible (do not store or freeze).
Mouse Periostin ELISA Assay Protocol
Read the entire protocol before beginning the assay
|
1. |
Bring samples and reagents to room temperature (18-26°C). |
|
2. |
Mark positions for STD/CTRL/SAMPLE (standard/control/sample) on the protocol sheet. |
|
3. |
Take microtiter strips out of the aluminum bag. Store unused strips with desiccant at 4°C in the aluminum bag. Strips are stable until expiry date stated on the label. |
|
4. |
Add 100 µl pre-diluted STD/CTRL/SAMPLE (standard/control/sample) into the respective wells. See chapters reagent preparation and sample preparation for details. |
|
5. |
Add 50 µl AB (biotinylated anti-Periostin antibody, green cap) into each well, swirl gently. |
|
6. |
Cover the plate tightly and incubate for 3 hours at room temperature (18-26°C). |
|
7. |
Aspirate and wash wells 5 x with 300 µl diluted WASHBUF. After the final wash, remove the remaining WASHBUF by strongly tapping plate against a paper towel. |
|
8. |
Add 150 µl CONJ (conjugate, amber cap) into each well. Swirl gently. |
|
9. |
Cover tightly and incubate for 1 hour at room temperature. |
|
10. |
Aspirate and wash wells 5 x with 300 µl diluted WASHBUF. After the final wash, remove the remaining WASHBUF by strongly tapping plate against a paper towel. |
|
11. |
Add 150 µl SUB (substrate, blue cap) into each well. |
|
12. |
Incubate for 30 min at room temperature in the dark. |
|
13. |
Add 50 µl STOP (stop solution, white cap) into each well. Swirl gently. |
|
14. |
Measure absorbance immediately at 450 nm with reference 630 nm, if available. |
Calculation of Results
Read the optical density (OD) of all wells on a plate reader using 450 nm wavelength (reference wavelength 630 nm). Construct a standard curve from the absorbance read-outs of the standards using commercially available software capable of generating a four-parameter logistic (4-PL) fit. Alternatively, plot the standards’ concentration on the x-axis against the mean absorbance for each standard on the y-axis and draw a best fit curve through the points on the graph. Curve fitting algorithms other than 4-PL have not been validated and will need to be evaluated by the user.
Samples, control, and standards are all diluted 1+200 prior to the assay. Hence, there is no need to take this dilution factor into account. Sample concentrations can be read directly from the standard curve.
Sample dilutions above 1+200 have to be considered when calculating the final sample concentration.
The quality control (QC) protocol supplied with the kit shows the results of the final release QC for each kit lot. Data for OD obtained by customers may differ due to various influences including the normal decrease of signal intensity throughout shelf life. However, this does not affect validity of results as long as an OD of 1.00 or more is obtained for the STD with the highest concentration and the value of the CTRL is within the target range (see label).
Periostin Protein
Periostin (OSF-2) is secreted as a homodimeric soluble extracellular matrix protein expressed in collagen-rich fibrous connective tissues. Periostin is involved in osteoblast recruitment, attachment and spreading. It has been associated with the epithelial-mesenchymal transition in cancer and with the differentiation of mesenchyme in the developing heart. Periostin has functions in osteology, tissue repair, oncology, cardiovascular and respiratory diseases, and in various inflammatory settings. There are at least 5 isoforms of mouse Periostin, caused by alternative splicing (http://www.uniprot.org/uniprot/Q15063).
|
Molecular weight |
93 kDa |
|
Cellular localisation |
Extracellular or secreted |
|
Post-translational modifications |
Glycosylation, disulphide bonds |
|
Sequence similarities |
FAS1 superfamily |
|
Alternative names |
POSTN, OSF-2, OSF2, PDLPN, PN |
|
OMIM |
|
|
Uniprot ID |
Periostin Function
Periostin is involved in osteoblast recruitment, attachment and spreading. It has been associated with the epithelial-mesenchymal transition in cancer and with the differentiation of mesenchyme in the developing heart. Periostin has functions in osteology, tissue repair, oncology, cardiovascular and respiratory diseases, and in various inflammatory settings.
All Biomedica ELISAs are validated according to international FDA/ICH/EMEA guidelines. For more information about our validation guidelines, please refer to our quality page and published validation guidelines and literature.
-
CPMP/ICH/381/95
ICH Topic Q2 (R1) „Validation of Analytical Procedures: Text and Methodology“
including:
ICH Q2A “Text on Validation of Analytical Procedures”
ICH Q2B “Validation of Analytical Procedures: Methodology” -
Food and Drug Administration
Guidance for Industry, Bioanalytical Method Validation, Draft Guidance, September 2013
Calibration
The mouse Periostin immunoassay is calibrated against recombinant mouse Periostin isoform 1 of Q62009 (Uniprot ID).
Mouse Periostin ELISA Detection Limit & Sensitivity
To determine the sensitivity of the mouse Periostin ELISA, experiments measuring the lower limit of detection (LOD) and the lower limit of quantification (LLOQ) were conducted.
The LOD, also called the detection limit, is the lowest point at which a signal can be distinguished above the background signal, i.e. the signal that is measured in the absence of Periostin, with a confidence level of 99%. It is defined as the mean back calculated concentration a Periostin-free sample (three independent measurements) plus three times the standard deviation of the measurements.
The LLOQ, or sensitivity of an assay, is the lowest concentration at which an analyte can be accurately quantified. The criteria for accurate quantification at the LLOQ are an analyte recovery between 75 and 125% and a coefficient of variation (CV) of less than 25%. The lowest concentration of Periostin, which meets both criteria, is reported as the LLOQ.
The following values were determined for the mouse Periostin ELISA:
|
LOD |
0.003 nmol/l |
|
LLOQ |
0.125 nmol/l |
Mouse Periostin ELISA Precision
The precision of an ELISA is defined as its ability to measure the same concentration consistently within the same experiments carried out by one operator (within-run precision or repeatability) and across several experiments using the same samples but conducted by several operators at different locations using different ELISA lots (in-between-run precision or reproducibility).
Within-Run Precision
Within-run precision was tested by measuring the same samples five times within one mouse Periostin ELISA lot. The experiment was conducted by one operator.
|
ID |
n |
Mean mouse Periostin [nmol/l] |
SD [pmol/l] |
CV (%) |
|
Sample 1 |
5 |
1.0 |
0.06 |
6 |
|
Sample 2 |
5 |
7.8 |
0.14 |
2 |
In-Between-Run Precision
In-between-run precision was assessed by measuring the same samples 15 times within multiple mouse Periostin ELISA lots. The measurements were carried out by multiple operators.
|
ID |
n |
Mean mouse Periostin [nmol/l] |
SD [pmol/l] |
CV (%) |
|
Sample 1 |
15 |
1.0 |
0.06 |
6 |
|
Sample 2 |
15 |
7.9 |
0.22 |
3 |
Mouse Periostin ELISA Accuracy
The accuracy of an ELISA is defined as the precision with which it can recover samples of known concentrations.
The recovery of the mouse Periostin ELISA was measured by adding recombinant mouse Periostin to mouse samples containing a known concentration endogenous Periostin. The % recovery of the spiked concentration was calculated as the percentage of measured compared over the expected value.
This table shows the summary of the recovery experiments in the mouse Periostin ELISA in different sample matrices:
|
% Recovery |
|||||
|
+1.6 nmol/l |
+8 nmol/l |
||||
|
Sample matrix |
n |
Mean |
Range |
Mean |
Range |
|
Mouse serum |
4 |
72 |
60 - 86 |
97 |
88 - 107 |
|
Mouse plasma |
4 |
86 |
67 - 96 |
88 |
70 - 100 |
Data showing recovery of Periostin in mouse serum samples:
|
|
Mouse Periostin [nmol/l] |
% Recovery |
||||
|
Sample matrix |
ID |
Reference |
+1.6 nmol/l |
+8 nmol/l |
+1.6 nmol/l |
+8 nmol/l |
|
Mouse serum |
ms1 |
1.7 |
2.7 |
7.8 |
79 |
88 |
|
Mouse serum |
ms2 |
4.1 |
2.7 |
9.2 |
60 |
89 |
|
Mouse serum |
ms3 |
3.4 |
4.0 |
10.2 |
64 |
107 |
|
Mouse serum |
ms4 |
2.5 |
3.6 |
9.7 |
86 |
105 |
|
|
|
|
|
Mean |
72 |
97 |
|
|
|
|
|
Min |
60 |
88 |
|
|
|
|
|
Max |
86 |
107 |
Data showing recovery of Periostin in mouse plasma samples:
|
Mouse Periostin [nmol/l] |
% Recovery |
|||||
|
Sample matrix |
ID |
Reference |
+1.6 nmol/l |
+8 nmol/l |
+1.6 nmol/l |
+8 nmol/l |
|
Mouse plasma |
mp1 |
2.9 |
3.6 |
67 |
67 |
70 |
|
Mouse plasma |
mp2 |
3.2 |
4.4 |
96 |
96 |
85 |
|
Mouse plasma |
mp3 |
2.6 |
3.7 |
85 |
85 |
98 |
|
Mouse plasma |
mp4 |
3.2 |
4.4 |
96 |
96 |
100 |
|
|
|
|
|
Mean |
86 |
88 |
|
|
|
|
|
Min |
67 |
70 |
|
|
|
|
|
Max |
96 |
100 |
Mouse Periostin ELISA Dilution Linearity and Parallelism
Tests of dilution linearity and parallelism ensure that both endogenous and recombinant samples containing mouse Periostin behave in a dose dependent manner and are not affected by matrix effects. Dilution linearity assesses the accuracy of measurements in diluted mouse samples spiked with known concentrations of recombinant analyte. By contrast, parallelism refers to dilution linearity in mouse samples and provides evidence that the endogenous analyte behaves the same way as the recombinant one. For dilution linearity and parallelism are assessed for each sample type and are considered acceptable if the results are within 20% of the expected concentration.
Dilution Lineartiy
Dilution linearity was assessed by serially diluting mouse samples spiked with 8 nmol/l recombinant mouse Periostin.
The table below shows the mean recovery and range of serially diluted recombinant mouse Periostin in mouse serum and plasma:
|
% Recovery of recombinant mouse Periostin in diluted samples |
|||||||
|
1 + 1 |
1 + 3 |
1 + 7 |
|||||
|
Sample matrix |
n |
Mean |
Range |
Mean |
Range |
Mean |
Range |
|
Mouse serum |
4 |
120 |
111-135 |
117 |
110 - 130 |
111 |
97 - 118 |
|
Mouse plasma |
4 |
113 |
109 - 120 |
102 |
99 - 106 |
93 |
89 - 96 |
Data showing dilution linearity of recombinant mouse Periostin in mouse serum samples. Reference values indicate sample concentrations after the 8 nmol/l spike:
|
Mouse Periostin [nmol/l] |
% Recovery |
|||||||
|
Sample matrix |
ID |
Reference |
1+1 |
1+3 |
1+7 |
1+1 |
1+3 |
1+7 |
|
Mouse serum |
ms1 |
10.1 |
6.8 |
3.3 |
1.5 |
135 |
130 |
118 |
|
Mouse serum |
ms2 |
10.1 |
6.0 |
2.8 |
1.2 |
118 |
110 |
97 |
|
Mouse serum |
ms3 |
11.5 |
6.6 |
3.3 |
1.6 |
115 |
114 |
112 |
|
Mouse serum |
ms4 |
11.7 |
6.5 |
3.4 |
1.7 |
111 |
115 |
115 |
|
Mean |
120 |
117 |
111 |
|||||
|
Min |
111 |
110 |
97 |
|||||
|
Max |
135 |
130 |
118 |
|||||
Data showing dilution linearity of recombinant mouse Periostin in mouse plasma samples. Reference values indicate sample concentrations after the 8 nmol/l spike:
|
Mouse Periostin [nmol/l] |
% Recovery |
|||||||
|
Sample matrix |
ID |
Reference |
1+1 |
1+3 |
1+7 |
1+1 |
1+3 |
1+7 |
|
Mouse plasma |
mp1 |
7.4 |
4.2 |
2.0 |
0.9 |
113 | 106 |
96 |
|
Mouse plasma |
mp2 |
8.2 |
4.5 |
2.1 |
0.9 |
110 |
99 |
89 |
|
Mouse plasma |
mp3 |
7.6 |
4.6 |
1.9 |
0.9 |
120 |
99 |
96 |
|
Mouse plasma |
mp4 |
8.1 |
4.4 |
2.1 |
0.9 |
109 |
106 |
91 |
|
Mean |
113 |
102 |
93 |
|||||
|
Min |
109 |
99 |
89 |
|||||
|
Max |
120 |
106 |
96 |
|||||
Parallelism
Parallelism was assessed by serially diluting mouse samples containing endogenous mouse Periostin with assay buffer.
The table below shows the mean recovery and range of serially diluted endogenous mouse Periostin in mouse serum and plasma samples:
|
%Recovery of endogenous mouse Periostin in diluted samples |
|||||
|
1+1 |
1+3 |
||||
|
Sample matrix |
ID |
Mean |
Range |
Mean |
Range |
|
Mouse serum |
4 |
116 |
114 - 119 |
113 |
110 - 116 |
|
Mouse plasma |
4 |
128 |
121 - 147 |
130 |
108 - 163 |
Data showing dilution linearity of endogenous mouse Periostin in mouse serum samples:
|
Mouse Periostin [nmol/l] |
% Recovery |
|||||
|
Sample matrix |
ID |
Reference |
1+1 |
1+3 |
1+1 |
1+3 |
|
Mouse serum |
ms1 |
1.7 |
0.9 |
0.5 |
115 |
116 |
|
Mouse serum |
ms2 |
4.1 |
2.5 |
1.1 |
119 |
111 |
|
Mouse serum |
ms3 |
3.4 |
1.9 |
0.9 |
114 |
110 |
|
Mouse serum |
ms4 |
2.5 |
1.4 |
0.7 |
116 |
116 |
|
|
|
|
|
Mean |
128 |
130 |
|
|
|
|
|
Min |
121 |
108 |
|
|
|
|
|
Max |
147 |
163 |
Data showing dilution linearity of endogenous mouse Periostin in mouse plasma samples:
|
Mouse Periostin [nmol/l] |
% Recovery |
|||||
|
Sample matrix |
ID |
Reference |
1+1 |
1+3 |
1+1 |
1+3 |
|
Mouse plasma |
mp1 |
2.9 |
2.1 |
1.2 |
147 |
163 |
|
Mouse plasma |
mp2 |
3.2 |
1.9 |
0.9 |
121 |
108 |
|
Mouse plasma |
mp3 |
2.6 |
1.6 |
0.7 |
122 |
114 |
|
Mouse plasma |
mp4 |
3.2 |
2.0 |
1.1 |
123 |
134 |
|
|
|
|
|
Mean |
128 |
130 |
|
|
|
|
|
Min |
121 |
108 |
|
|
|
|
|
Max |
147 |
163 |
Mouse Periostin ELISA Specificity
The specificity of an ELISA is defined as its ability to exclusively recognize the analyte of interest.
The specificity of the mouse Periostin ELISA was shown by characterizing both the capture and the detection antibody through epitope mapping and affinity measurements. In addition, the specificity of the ELISA was established through competition experiments, which measure the ability of the antibodies to exclusively bind mouse Periostin.
This assay recognizes endogenous and recombinant mouse Periostin.
Competition of Signal
Competition experiments were carried out by pre-incubating mouse samples with an excess of capture antibody. The concentration measured in this mixture was then compared to a reference value, which was obtained from the same sample without the pre-incubation step.
The table below shows the competition of endogenous concentrations of mouse Periostin in mouse samples:
|
Mouse Periostin [nmol/l] |
% Competition |
|||
|
Sample matrix |
ID |
Reference |
Reference + antibody |
|
|
Serum |
ms1 |
9.2 |
0.0 |
100 |
|
Serum |
ms2 |
8.6 |
0.0 |
100 |
|
Serum |
ms3 |
10.1 |
0.0 |
100 |
|
Serum |
ms4 |
10.0 |
0.0 |
100 |
|
Plasma |
mp1 |
2.9 |
0.0 |
100 |
|
Plasma |
mp2 |
3.0 |
0.0 |
100 |
|
Plasma |
mp3 |
2.8 |
0.0 |
100 |
|
Plasma |
mp4 |
3.4 |
0.0 |
100 |
Isoforms of Mouse Periostin
Currently, five different isoforms of mouse Periostin (http://www.uniprot.org/uniprot/Q62009) have been identified. They are generated by alternative splicing.
Recombinant mouse Periostin used in this assay is identical to Q62009-1 (isoform 1): 838AA, mass (Da): 93,144.
This mouse Periostin ELISA assay detects:
-
Isoform 1 (mouse Periostin recombinant standard/calibrator utilized in this assay)
-
Isoform 2 (due to sequence homology)
-
Isoform 3 (due to sequence homology)
-
Isoform 5 (experimentally analyzed with recombinant protein).
Isoform 4 shows a change of sequence in the respective epitope of the capture antibody. Thus, it is not certain if this assay detects Isoform 4.
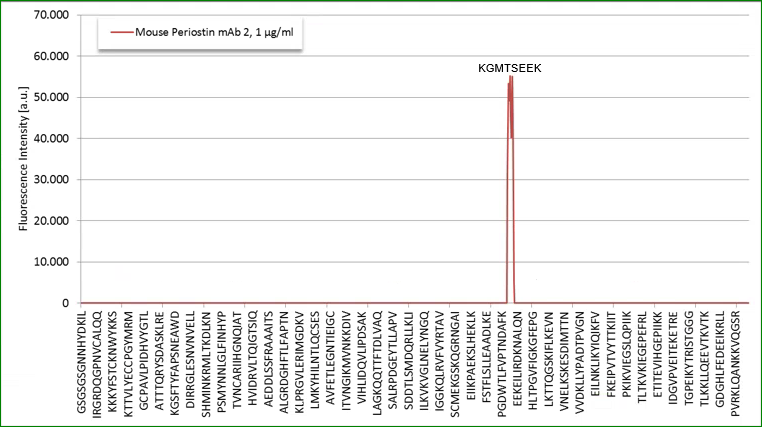
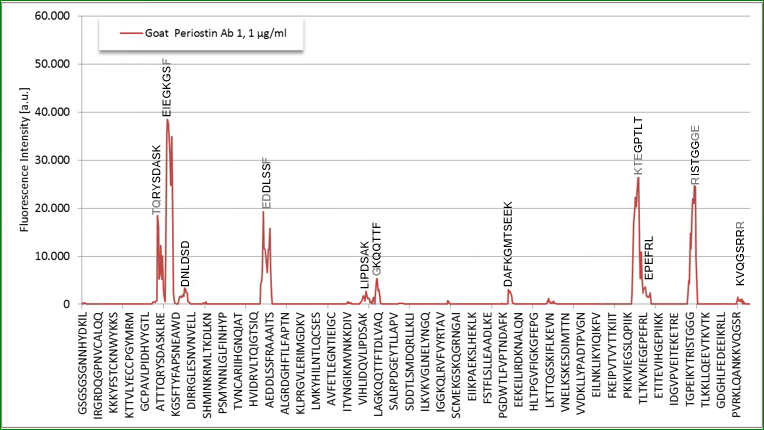
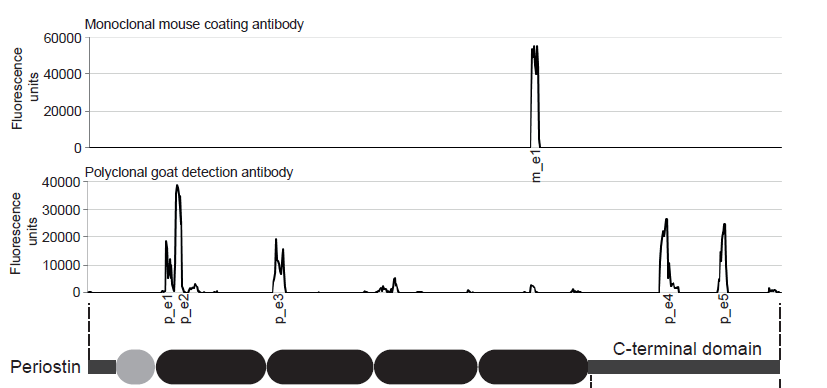
Epitop Mapping of Utilized Antibodies
Epitop mapping has been performed by Pepperprint.
Capture Antibody:
The capture antibody which is a monoclonal mouse antibody binds to m_e1: KGMTSEER (AA544-551) of Q62009-1 (isoform 1).
Detection Antibody:
|
p_e1: TQHYSDVSK (AA115-123) |
|
p_e2: EIEGKGSY (AA127-134) |
|
p_e3: EDDLSSF (AA246-252) |
|
p_e4: PAMT (AA672-676) |
|
p_e5: RISTGGGE (AA738-746) |
Summary:
Sample Stability
Sample Preparation
We recommend separating plasma or serum by centrifugation as soon as possible, e.g. 20 min at 2,000 x g, preferably at 4°C (2-8°C). Samples can be stored at 4°C (2-8°C) overnight. For long term storage, aliquot the acquired plasma or serum samples and store at -25°C or lower.
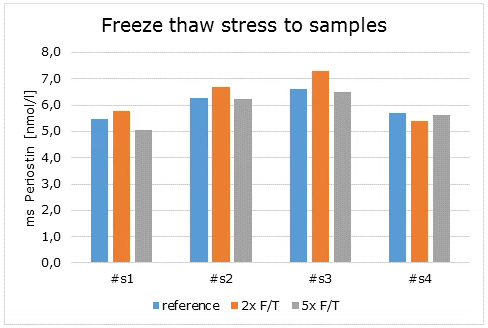
Freeze-Thaw Stability
The stability of endogenous mouse Periostin was tested by comparing mouse Periostin measurements in samples that had undergone five freeze-thaw (F/T) cycles. The mean recovery of sample concentration after five freeze-thaw cycles is 97%.
|
Mouse Periostin [pmol/l] |
Mean Recovery [%] |
||||||
|
Sample matrix |
ID |
Reference |
2x F/T |
5x F/T |
2x F/T |
5 x F/T |
|
|
Serum |
s1 |
5.5 |
5.8 |
5.0 |
106 |
92 |
|
|
Serum |
s2 |
6.3 |
6.7 |
6.2 |
107 |
100 |
|
|
Serum |
s3 |
6.6 |
7.3 |
6.5 |
110 |
98 |
|
|
Serum |
s4 |
5.7 |
5.4 |
5.6 |
95 |
99 |
|
|
Mean |
108 |
97 |
|||||
Undiluted samples can be subjected to five freeze-thaw cycles.
Sample Values
Periostin Values in Healthy Control Mice
To provide expected values for circulating mouse Periostin, a panel of samples from healthy mice was tested.
A summary of the results is shown below:
|
Mouse Periostin [nmol/l] |
||||
|
Sample type |
Sample matrix |
n |
Median |
Range |
|
Adult mice |
Serum |
28 |
3.4 |
1.6 – 5.4 |
|
Adult mice |
Plasma |
5 |
2.5 |
1.3 – 2.9 |
|
4 week old mice, female |
Serum |
13 |
8.0 |
5.3 – 10.0 |
|
4 week old mice, male |
Serum |
11 |
8.4 |
7.6 – 10.1 |
We recommended establishing the normal range for each laboratory.
Matrix Comparison
Comparison of mouse serum and plasma samples
|
Mouse periostn [nmol/l] |
||||||
|
Sample matrix |
n |
Mean |
Median |
Min | Max | SD |
|
Mouse serum |
28 |
3.47 | 3.35 | 1.6 | 5.4 | 0.93 |
|
Mouse plasma |
5 |
2.4 |
2.5 |
1.3 |
2.9 |
0.64 |
- Age- and Strain-Related Differences in Bone Microstructure and Body Composition During Development in Inbred Male Mouse Strains. Papageorgiou M., Föger-Samwald U., Wahl K., Kerschan-Schindl K., Pietschmann P., 2020. Calcif Tissue Int;106(4):431-443. PMID: 31901965.
-
Age- and Strain-Related Differences in Bone Microstructure and Body Composition During Development in Inbred Male Mouse Strains. Papageorgiou, M., Föger-Samwald, U., Wahl, K., Kerschan-Schindl, K., Pietschmann, P., 2020. Calcif Tissue Int.
-
Validated and in-depth characterized sandwich ELISA for the quantification of mouse periostin. Gadermaier E., Wallwitz J., Berg G., Himmler G. ASBMR 2018.
 Download biomedica product list
